
Third Quarter Performance Report
The three-month period from July to September 2025 saw strong growth across all of JCIC’s portfolios.

This report is presented by Kai Lam, JCIC’s Chief Investment Officer.
Extremely Strong Performance during Q3 (July-September 2025)
In the third quarter, our JCIC Balanced Fund gained 6.7% (+11.3% year-to-date), while the JCIC Equity Fund rose 7.7% (+14.7% year-to-date). By strategy, the US Equity portfolio returned 10.5% (+11.1% YTD), the International Equity portfolio returned 6.8% (+32.0% YTD), and the Global Growth Equity portfolio gained 9.4% (+31.6% YTD). All figures are in Canadian dollars.
In the US, top performers included Alphabet Inc. (+40.1%), Valero Energy Corp. (+30.2%), and Apple Inc. (+26.7%). Strong international performers included Taiwan Semiconductor (+26.1%), Sony Group Corp. (+16.7%), and Rheinmetall AG (+12.4%). In Canada, leading contributors were Agnico Eagle Mines Ltd. (+44.9%), Shopify Inc. (+31.6%), and Gildan Activewear Inc. (+20.3%).

Economic and Market Overview
Trade negotiations between Canada and the US remain unresolved, though most Canadian exports to the US continue under the existing CUSMA agreement. The US, meanwhile, secured trade agreements with several major partners, including Europe, the UK, and Japan.
In Canada, tariff uncertainty has led to slower business activity as companies delay spending decisions. GDP contracted by 1.6% in Q2, and the unemployment rate rose to 7.1% (figure 1) , up from 5% in early 2023. The Bank of Canada resumed rate cuts, lowering its policy rate by 25 basis points to 2.5% (figure 2)—its first cut since March 2025, following a peak rate of 5.5% in May 2024. Markets are now anticipating another cut by late 2025 or early 2026.
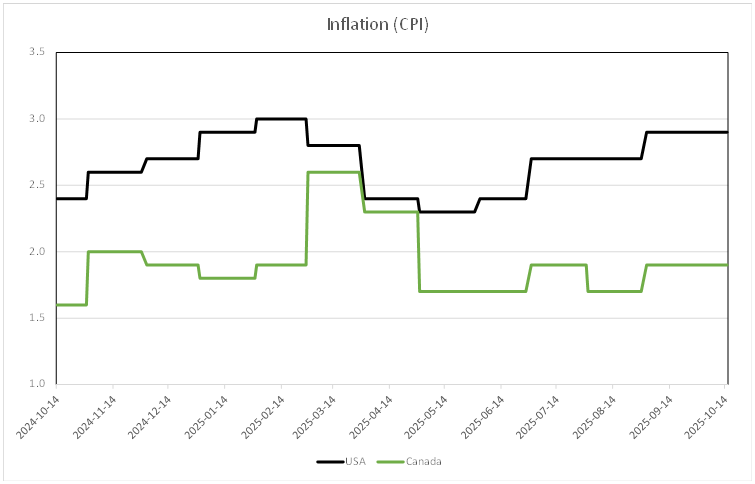
In the US, labor data showed signs of softening (figure 1), which the market viewed positively as it supported the case for lower rates. The Federal Reserve cut rates by 25 basis points in September (figure 2), bringing the policy rate to 4.25%—its first cut since December 2024. Despite inflation rebounding to 2.9% (figure 3), markets currently expect two additional 25-basis-point cuts by year-end, with further easing likely in 2026.
Figure 1. Canadian and US Unemployment Rates

Source: Bloomberg
Figure 2. Canadian and US Bank Rates

Source: Bloomberg
Figure 3. Canadian and US Inflation Rates
Source: Bloomberg
While employment data has weakened, global GDP growth estimates for 2025 have actually been improving since the summer (figure 4). The impact of US tariffs have not been as bad as first feared and the US has reached many trade deals globally. The average tariff for US imports will permanently increase and put pressure on inflation, which we see in figure 3. However, it has been relatively manageable since services account for over two-thirds of the US economy, which are not subject to tariffs.
Figure 4. Regional Growth Forecasts

Source: Bloomberg
Bay Street/Wall Street Versus Main Street
Despite mixed economic signals, equity markets performed strongly during the quarter. The S&P 500 Total Return Index gained 10.6% in Canadian dollar terms and 11.1% year-to-date, while the S&P/TSX Composite Total Return Index rose 12.5% in Q3 and 23.9% year-to-date.
We continue to remind investors that Wall Street (or Bay Street) often diverges from Main Street—that is, equity markets can remain resilient even when economic data appear soft.
In Canada, gold equities have been standout performers this year, supported by a weaker US dollar, heightened geopolitical risk, and increased central bank demand for gold as a reserve diversification strategy. Gold stocks now account for roughly one-third of the TSX’s year-to-date gains. Combined with Shopify, these two segments together contributed over 40% of the TSX’s performance, despite representing less than 20% of the index.
In the US, market gains were concentrated in large-cap technology names. The top 10 stocks in the S&P 500 now represent about 40% of its total market capitalization. Within the top 10, NVIDIA, Microsoft, Broadcom, Meta, and Alphabet—key beneficiaries of artificial intelligence (AI) trends—have delivered strong earnings growth, fueling over half of the market’s advance this year.

Outlook
Market valuations have risen, leading JCIC to take profits in select holdings where potential upside has become more limited relative to downside risk. At the same time, market performance has been highly concentrated, with a significant divergence between sectors and individual stocks. As shown in Figure 5, the S&P 500 Index’s forward Price/Earnings ratio is now more than one standard deviation above its 10-year average. In contrast, Figure 6 shows the Equally Weighted S&P 500 Index trading at a forward P/E that is roughly 15% lower than the market-cap-weighted index, where the top 10 stocks account for about 40% of total market capitalization. This valuation gap has created attractive long-term opportunities, particularly in areas that have been temporarily pressured by concerns over government policy or potential disruptions from AI advancements.
Ultimately, the market is driven by earnings. At JCIC, we continue to invest with a long-term focus, guided by company fundamentals rather than short-term market movements or headlines.
Figure 5.

Source: Bloomberg
Figure 6.

Source: Bloomberg

If you have questions about any of this information, please don’t hesitate to reach out to us:
Disclosure:
Although we obtain information contained in our newsletter from sources we believe to be reliable, we cannot guarantee its accuracy. The opinions expressed in the newsletter are those of JCIC Asset Management, its editors and contributors, and may change without notice. Any views or opinions expressed in the newsletter may not reflect those of the firm as a whole. The information in our newsletter may become outdated and we have no obligation to update it. The information in our newsletter is not intended to constitute individual investment advice and is not designed to meet your personal financial situation. It is provided for information purposes only and nothing herein constitutes investment, legal, accounting or tax advice, or a recommendation to buy, sell or hold a security. No recommendation or advice is being given as to whether any investment is suitable for a particular investor or a group of investors. It should not be assumed that any investments in securities, companies, sectors or markets identified and described were or will be profitable. We strongly advise you to discuss your investment options with your Relationship Manager prior to making any investments, including whether any investment is suitable for your specific needs.
The information provided in our newsletter is private, privileged, and confidential information, licensed for your sole individual use as a subscriber. JCIC Asset Management reserves all rights to the content of this newsletter.
* Performance percentages stated are gross of fees.