
Q3 2025 Investment Report: Resilience Amid Interest Rate Volatility
In the third quarter of 2025, global markets navigated a complex landscape of unresolved trade negotiations, tariff uncertainties, and shifting interest rate policies. Despite soft macroeconomic indicators, disciplined portfolio positioning allowed JCIC's mandates to deliver exceptionally strong returns, demonstrating the power of active stewardship when market performance diverges from economic headlines.

Executive Summary: Key Takeaways
Strong Performance Across Mandates: The JCIC Balanced Fund gained +6.7% (+11.3% YTD), and the JCIC Equity Fund rose +7.7% (+14.7% YTD), driven by selective equity positioning and global diversification.
Macroeconomic Policy Divergence: Both the Bank of Canada and the U.S. Federal Reserve executed critical rate cuts during the quarter, bringing policy rates down to 2.5% and 4.25% respectively, signaling a cautious transition toward monetary easing.
Unresolved Trade Dynamics: While Canada-U.S. trade negotiations remain ongoing under the current CUSMA umbrella, domestic businesses face near-term tariff uncertainties, contributing to a modest GDP contraction of 1.6% in Q2 and a rise in unemployment to 7.1%.
The "Main Street" Divergence: Equity market indices delivered outstanding returns during the quarter (S&P 500 up +10.6% and S&P/TSX up +12.5%), illustrating that market performance often marches to a different beat than daily economic headlines.
Valuation Discrepancies: The forward Price/Earnings (P/E) ratio of the market-cap-weighted S&P 500 has drifted more than one standard deviation above its 10-year average. In contrast, the Equally Weighted S&P 500 trades at a roughly 15% discount, presenting lucrative entry points for active, selective investors.

Performance & Portfolio Review
Our investment strategies delivered exceptional performance during the third quarter (July to September 2025), significantly compounding capital across all core asset pools and thematic allocations.
Consolidated Performance Table (Q3 2025)
Note: All performance figures are reported in Canadian Dollar (CAD) terms.

Canadian and US Unemployment Rates (Source: Bloomberg)

Canadian and US Bank Rates (Source: Bloomberg)
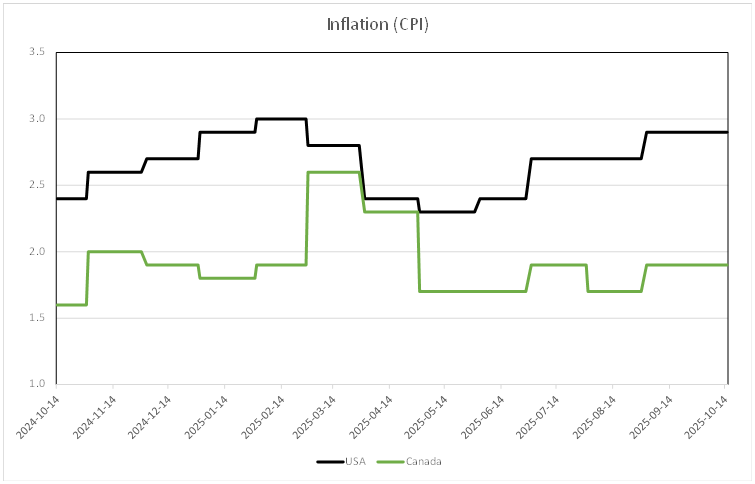
Canadian and US Inflation Rates (Source: Bloomberg)
Global Equity Performance Leaders
Our active stock-picking methodology yielded outstanding individual stock performances across all three geographical mandates, protecting client capital while participating fully in market upside.
Canadian Contributors: Performance was spearheaded by Agnico Eagle Mines Ltd. (+44.9%), Shopify Inc. (+31.6%), and Gildan Activewear Inc. (+20.3%). Gold equities acted as a vital ballast during the quarter.
United States Contributors: Leading performers in our unconstrained U.S. portfolio included Alphabet Inc. (+40.1%), Valero Energy Corp. (+30.2%), and Apple Inc. (+26.7%).
International Contributors: Top developed market performers overseas included Taiwan Semiconductor Manufacturing Co. (+26.1%), Sony Group Corp. (+16.7%), and defensive defense innovator Rheinmetall AG (+12.4%).

Regional Growth Forecasts (Source: Bloomberg)
Economic and Market Overview: Policy Pivots & Evolving Trade
1. Interest Rate Easing Cycle Resumes
The third quarter marked a long-awaited milestone for borrowers and investors as central banks resumed their interest rate-cutting programs.
The Bank of Canada: Following a long pause since its last action, the Bank of Canada executed a 25 basis point cut, bringing its benchmark policy rate down to 2.5%. This represents a substantial decline from the peak rate of 5.5% held in mid-2024. The domestic market actively anticipates an additional rate cut by late 2025 or early 2026.
The U.S. Federal Reserve: The Fed initiated its own easing path in September with a 25 basis point cut to 4.25%—its first rate reduction since December 2024. Despite a slight rebound in inflation to 2.9%, markets expect two additional 25 basis point cuts before the end of the year, with a steady trajectory of easing planned throughout 2026.
Monetary Policy Insight: > Bloomberg tracking of historical rate decisions highlights that central banks are moving away from restrictive monetary stances. While caution remains the watchword, this downward shift in yields provides a highly constructive backdrop for liquid equities and high-quality bond positions.
2. Trade and Tariff Uncertainties
Canada's near-term economic performance remains complicated by unresolved trade negotiations with the United States. Although the vast majority of Canadian exports continue to cross the border smoothly under the established CUSMA guidelines, the threat of impending tariffs has induced business friction.
Many domestic businesses have delayed capital expenditure and strategic expansion plans due to this uncertainty. This friction was reflected in Canada’s Q2 GDP contraction of 1.6% and a steady climb in the national unemployment rate to 7.1%.
Labor Market Insight: > Unemployment rates in both Canada and the U.S. have crept upward from their post-pandemic lows. While a softening labor market points to near-term economic cooling, central banks view this data positively as it validates the transition toward lower interest rates and moderating wage inflation.
3. Global Growth Outlook Upgrades
Interestingly, while individual labor markets show signs of cooling, consensus estimates for global GDP growth in 2025 have actually improved since the summer. The real-world impact of newly enacted U.S. tariffs has proven far less damaging than initially feared.
The U.S. has aggressively forged trade agreements with major partners, including Europe, the UK, and Japan. While the average tariff on U.S. imports is set to permanently rise—placing modest upward pressure on goods inflation—the overall impact remains highly manageable because over two-thirds of the U.S. economy is driven by the services sector, which is naturally insulated from physical import tariffs.
Bay Street & Wall Street vs. Main Street
A common point of confusion for investors is the stark divergence between market performance and economic headlines. During the third quarter, while trade negotiations stalled and GDP contracted, stock markets surged to near-historic highs.
This divergence illustrates the classic rule: the stock market is not the economy. Equity markets are forward-looking engines that evaluate future earnings potential, whereas economic reports like GDP and unemployment are lagging indicators.
Comparison: Market Focus vs. Economic Focus
| Stock Market (Forward-Looking) | Economic Data (Lagging) |
|---|---|
| Future Corporate Profits: Focuses on projected business earnings and operational scale over the next $12$ to $18$ months. | Historical GDP ($Q2$): Measures past economic production and output that occurred months prior. |
| Declining Policy Rates: Prices in anticipated central bank liquidity injections and rate easing cycles. | Past Unemployment Trends: Reflects retrospective hiring and firing cycles from older payroll data. |
| Secular Megatrends: Capitalizes on structural transitions, such as global Artificial Intelligence (AI) expansion. | Unresolved Trade Talks: Evaluates backward-looking tariff friction, current domestic policy, and trade standoffs. |
Canada: The Gold & Shopify Engine
In Canada, a significant portion of the S&P/TSX Composite's +23.9% YTD performance was driven by a highly concentrated basket of assets:
The Flight to Safety: Gold equities have been stellar performers this year, supported by a softer U.S. dollar, geopolitical instability, and massive buying campaigns by global central banks seeking reserve diversification. Gold stocks currently account for nearly one-third of the TSX’s year-to-date gains.
The Tech Standard: Combined with the resurgence of Shopify Inc., these two specific segments accounted for over 40% of the TSX's total year-to-date gains, despite representing less than 20% of the total index.
United States: Large-Cap Tech Concentration
A similar concentration phenomenon defined the S&P 500. Market gains remain heavily concentrated in the top 10 mega-cap companies, which now represent roughly 40% of the total index market capitalization. Within this group, key beneficiaries of generative AI—including NVIDIA, Microsoft, Broadcom, Meta, and Alphabet—have delivered explosive earnings growth, powering more than half of the S&P 500's entire advance this year.

Outlook: Active Stewardship Amid Valuation Divergences
As market valuations rise, the importance of disciplined, fundamental research becomes paramount. Passive index investors are currently buying into highly concentrated markets at premium prices, whereas active managers can exploit clear valuation gaps.
Valuation and Market Structure Insight: According to Bloomberg forward valuation data, the market-cap-weighted S&P 500 is trading at a forward P/E ratio that is more than one standard deviation above its 10-year historical average.
In contrast, the Equally Weighted S&P 500 trades at a forward P/E ratio that is approximately $15\%$ lower. Because the equal-weighted index is not skewed by the massive market caps of the top 10 tech giants, it represents a far more attractive, broad-based valuation level.

(Source: Bloomberg)

(Source: Bloomberg)

This deep valuation gap has created exceptional opportunities for JCIC’s portfolio managers. We are actively taking profits in several highly appreciated holdings where the upside potential has become limited relative to downside risk.
We are systematically redeploying this capital into high-quality, dividend-paying companies that have been temporarily pressured by short-term macroeconomic worries, political headlines, or unfounded fears of artificial intelligence disruption.
Ultimately, stock market performance is driven by cash flow and earnings. By sticking to our rigorous $10$-point scoring framework and ignoring short-term noise, we continue to build resilient, liquid portfolios designed to secure your long-term purchasing power.
If you have questions about any of this information, please don’t hesitate to reach out to us.

Disclosure: Although we obtain information contained in our newsletter from sources we believe to be reliable, we cannot guarantee its accuracy. The opinions expressed in the newsletter are those of JCIC Asset Management, its editors and contributors, and may change without notice. Any views or opinions expressed in the newsletter may not reflect those of the firm as a whole. The information in our newsletter may become outdated and we have no obligation to update it.
The information in our newsletter is not intended to constitute individual investment advice and is not designed to meet your personal financial situation. It is provided for information purposes only and nothing herein constitutes investment, legal, accounting or tax advice, or a recommendation to buy, sell or hold a security. No recommendation or advice is being given as to whether any investment is suitable for a particular investor or a group of investors. It should not be assumed that any investments in securities, companies, sectors or markets identified and described were or will be profitable.
We strongly advise you to discuss your investment options with your Relationship Manager prior to making any investments, including whether any investment is suitable for your specific needs.
The information provided in our newsletter is private, privileged, and confidential information, licensed for your sole individual use as a subscriber. JCIC Asset Management reserves all rights to the content of this newsletter.